Figures Guide
The Web Almanac is about combining the raw stats and trends of the HTTP Archive with the expertise of the web community. As such presenting the data in the chapters in various figures is critical to the aims and success of the project.

We want well-presented figures that are consistent throughout the chapters and are as accessible as possible across a wide variety of devices, while also enabling additional features to analyze the data both now and in the future.
- Why use figures?
- Who is responsible for creating figures?
- Types of visuals in the Web Almanac
- Writing good captions and descriptions
- How to embed figures in the chapters
- How to take screenshots of Google Sheet graphics
- Tips and advice
Without figures, we would simply be discussing stats directly in text. This can still get the point across to readers, but it's not very engaging. Figures serve a few purposes:
- Figures call attention to the data points worth discussing
- Figures break up monotonous blocks of text and make chapters easier to read
- Readers can more easily grasp the magnitude of the data and compare data points based on size
Figures are also treated as landmarks within the chapter. Each figure has an ID that can be deep-linked and referenced later in the chapter, for example "Recall from [Figure 21](#fig-21)".
Figures are treated as portals into our methodology. We annotate every figure with metadata to enable readers to dive into different layers of the analysis. Readers can drill into a figure to see how the data was queried and view the raw results in the spreadsheet. This kind of access is important to the openness and transparency of the Web Almanac methodology, and something that sets us apart from other "state of the web" research.


Note: these deeper layers of the methodology should be available to readers who are explicitly looking for it, but should not typically be treated as top-level parts of our content. That is to say that readers should give some indication that they want to dig deeper before we present them with links to queries or spreadsheets. The standard way readers do this is by clicking into the three-dot menu in the corner of the figure. At the bottom of each chapter we also provide "View results" and "View queries" buttons in the context of other chapter-level meta actions. We should avoid linking directly to specific queries or spreadsheets in the text. If the results are worth discussing, use a figure!
Given their visual nature, figures also have accessibility challenges. We've created primitives to address some of these challenges and help chapter authors ensure that the results conveyed visually are also described textually. Figures have a written description that can be toggled in the UI as well as alt and aria attributes for users with assistive technologies and even SEO. The written descriptions are also particularly useful for people who may not necessarily have trouble seeing the figures, but they do have trouble understanding the figures. We consider accessibility to be an unresolved issue and we're constantly looking for ways to improve it.
In short - we all are!
- Analysts should create the data from SQL queries of the HTTP Archive and CrUX datasets.
- Authors should then review the data and pick which ones they would like to include in the chapter and provide some guidance on what format they want this presented in (chart, tables...etc.)
- Authors should also select any external data sources (images, videos...etc.) from their experience as experts in the given topic. Images should be copied locally to the chapter directory in git and so authors should ensure they have permission to use any external images.
- Analysts should then create the charts in Google Sheets, export the fallback images and add to Git, and provide the basic markup to the Authors as described below.
- Authors should then add/review Captions and Descriptions as they are the writers not the Analysts.
- Once a chapter is ready for review, Reviewers should review the figures and ensure they are technically correct and back up what is being stated in the text.
- Editors should review figures to ensure they are marked up correctly, are descriptive, easily understood by non-experts, and follow a consistent style across chapters.
- Developers should add new functionality to make adding figures easier.
We've a few different options for embedding figures (and there are code samples for these below), but they fall into these categories:
As of this writing we use Google Sheets to gather the results of our analysis. We then make iframes embeds of the graphs it produces to give interactive visuals on hover (example). These are supplemented by fallback images where Sheets graphs are not loaded depending on network and device capabilities (e.g. on mobile we use the fallback images). Additional information can be provided in tables (see below).
Analysts are encouraged to present the data in the most readable and interesting way and a Data Visualization Template Sheet has been created with various examples in the Web Almanac style (note annoyingly you need Edit access to this sheet to be able to copy these template layouts into your own Sheet - please request this if needed). On top of this @rviscomi has created a video to show you how to apply these to your data (about the 1min 20 seconds mark for chart example). See also examples from the 2019 Web Almanac for column bar charts, pie charts, scatter charts, percentage stacked bar chart and more complex bar charts with lots of data.
Please keep the following in mind when creating visuals in Sheets:
- Use sentence case (first word starts with capital letter, the rest start with lowercase, except for acronyms or proper nouns) for chart titles and also axis titles.
- Keep to standard charts sizes (600 x 371) as much as possible - see note below.
- Consider the label to use. Are your stats site wide (e.g. HTTP/2)? If so use "websites" for labelling charts and axis, not "sites", nor "pages", and also not "web sites". However if it's markup on the page (e.g. "median web page uses 43
h1elements), then "pages" makes more sense than "websites". - We have two colours - desktop is in light green, mobile in grey.
- Grey is preferred primary colour as easier to read. Be conscious when using just the green colour as data labels are difficult to read.
- It's good to drop secondary (green) data labels if chart is too crowded.
- Try to include both desktop and mobile, even if similar. It's good to show we've looked at both.
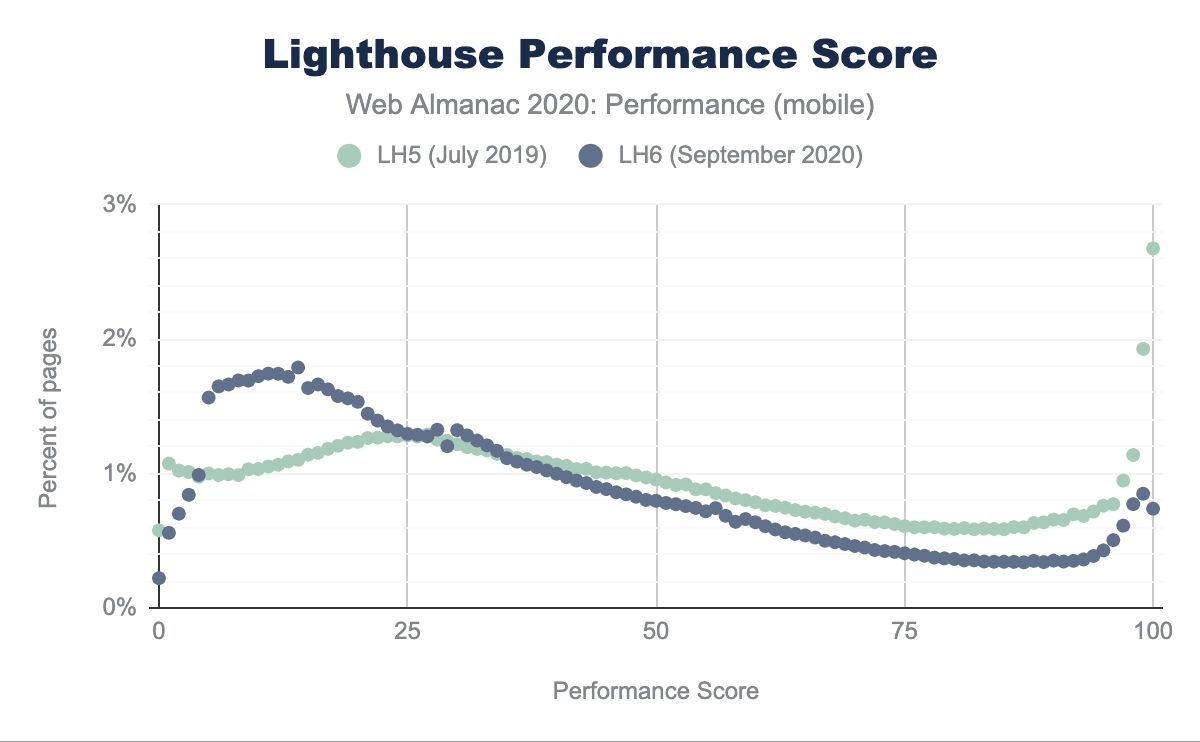
- If really do only want to only show one, then prefer mobile as we're in a mobile first world nowadays, we have more mobile sites, and some stats (e.g. lighthouse) is only available for mobile.
- Label Lighthouse and other mobile-only pages as such in the subtitle (example).
- Label CrUX as such in the subtitle (example)
- Label other third-party data sources in a similar manner.
- Use reasonably number of decimal places - usually two max, but often one will suffice.
Raw table data is also an option, either as an alternative to a graph, or as an additional figure to provide ease of access to the underlying statistics that make up a graph.
Note: We do not insist on tables for all graphs (as some publications might for accessibility reasons), as the data sheets themselves are made available and linked from the chapters. Instead, accessibility is handled with descriptive alt attributes, ARIA labels and ARIA descriptions which are given in the chapters in the figure markup.
Other images or videos which are not made of our data, or which are created outside of Google Sheets (e.g. complex graphs that sheets can’t handle or other HTTP archive stats), may also be included. Images should be added to the chapter directory, so they are hosted on our website. Credit and sources should be given, and authors should ensure they have permission to use the images. Videos should be hosted from YouTube where possible and a fallback image should be created for our ebook.
Call-out figures allow us to highlight key stats in each chapter and also help add a visual break to text. These are typically large text with a label (example large stats), but can also be smaller text for longer stats (example smaller text).
The Google Sheet embeds only give us limited interactivity (basically highlighting data on hover) and in 2020 we are looking at more interactive visualizations. This is being tracked in issue 896. Still deciding exactly what that will look like so please comment on that issue if you've a good candidate or any ideas on this!
We include two types of descriptions of figures:
- Caption
- Description
These are important for general readability, accessibility and SEO issues so authors should ensure these are written well.
The caption is the title of the figure, and also is used as the alt text (though it's possible to have different alt text too). The caption should explain what the figure is (e.g. "HTTP version usage for home pages."). It can include HTML or Markdown for <code> elements or source links (in which case a plain-text alt attribute should be included too as there's some question as to whether alt attributes should include HTML so we choose not to). Captions should be short - a sentence or two.
The description is a much more detailed piece of text, typically several sentences long. It is only required for images, videos and charts and not for tables. It should describe the contents of the figure for visually impaired users. Given that, try to break up really long sentences and use punctuation to give the listener/reader a chance to digest the description!
You should describe what the chart is showing and, where possible, include the actual statistics. You do not need to include the phrases "Picture of" or "Image of" as these will be announced by screen readers, but it can be helpful to explain the graph type (e.g. bar chart).
For example:
Bar chart showing the adoption of HSL, HSLA, RGB, RGBA, and hex color formats. Hex is used on 93% of desktop pages, RGBA on 83%, RGB on 22%, HSLA 19%, and HSL 1%. Desktop and mobile adoption is similar for all color formats except HSL, for which mobile adoption is 9% (9 times higher).
For more detailed graphs where listing all the data points is not feasible (or even desired if it was!), the main points apparent from viewing the chart should be described. For example:
Distribution of 1,000 desktop websites' fast, moderate, and slow FCP. The distribution of fast FCP appears to be linear from 100% to 0% with a slight bulge in the middle.
Jinja2 macros have been created to make it as easy as possible to embed figures in a consistent fashion, while avoiding complex markup or repetitive coding. This will also automatically handle figure numbering, creating anchor links and adding "Show Description" buttons. In future we hope to expand on this with direct links to query data and SQL so are asking for that information to be included in the markup.
Charts embedded in chapters may be made interactive by referencing a URL provided by Google Sheets. This URL is referenced by the figure attribute named chart_url (more info on these attributes in the section below). Each chart must be manually "published" to generate the corresponding interactive URL:
- Navigate to the results sheet containing the chart
- Click on the three-dot menu in the top right corner of the chart
- Select "Publish chart"
- Click "Publish"
- Use the URL in the "Link" tab as the value of the
chart_urlattribute

You will need edit access to the sheet to be able to publish a chart. Request edit access and ping @rviscomi if you need urgent access.
These can be created with the figure_markup macro (see examples below), which has the following options available:
| Attribute | Default value | Notes |
|---|---|---|
| image | The filename of the fallback image in the chapter directory. A fallback image for any Google Embeds must be provided for mobile. | |
| link | image | Where to go when the image is clicked - by default this will be the image itself, but it is possible to override if you want to link somewhere else. See example of why you might do this below. |
| video | The full URL of any video (in which case the image becomes the fallback image for print). | |
| caption | A short caption for the figure explaining the key points (see above). | |
| alt | caption | By default this uses the caption value, but an explicit alt attribute can be provided to remove HTML tags for example. |
| description | A short paragraph detailing the entire contents of the figure (see above). This should supplement the caption with additional information and ideally explain most of the stats. | |
| chart_url | The URL to the Google Sheets embed for this chart. | |
| sheets_gid | New for 2020! This will be used in future to link directly to the datasheet tab for this figure. | |
| sql_file | New for 2020! This will be used in future to link directly to the SQL query for this figure. | |
| width | 600 | The width of the image - this will default to 600 if not provided so must be provided if different. |
| height | 371 | The height of the image - this will default to 371 if not provided so must be provided if different. |
| video_width | width | The width of the video - defaults to same as image width. |
| video_height | height | The height of the video - defaults to same as image height. |
| data_width | width | The width of the chart - defaults to same as image width. |
| data_height | height | The height of the chart - defaults to same as image height. |
| content | The content for call-out figures - not required for Google Sheet images, videos or images. | |
| classes | Additional classes to be provided to the callout figure (e.g. big-number or really-big-number) - not required for Google Sheet images, videos or images. |
Be mindful to escape quotes (or switch between single and double quotes so you don't have to do this).
See how this looks in the 2019 CSS chapter
{{ figure_markup(
  image="direction-popularity.png",
  caption="Popularity of direction values.",
  description="Bar chart showing the popularity of direction values ltr and rtl. ltr is used by 32% of desktop pages and 40% of mobile pages. rtl is used by 32% of desktop pages and 36% of mobile pages.",
  chart_url="https://docs.google.com/spreadsheets/d/e/2PACX-1vQO5CabwLwQ5Lj1_9bbEFnFM1qEqCorymaBHrcaNiMSJ7sYDKHUI5iish5VAS-SxN447UTW-1-5-OjE/pubchart?oid=136847988&format=interactive",
  sheets_gid="693111191",
  sql_file="direction-popularity.sql"
  )
}}
If your images are not 600 by 371 then you need to provide height and width attributes. However as much as possible try to keep to this standard size, for consistency, and to ensure the chart is readable on mobile, and in the ebook. Some charts are taller and that’s OK but then should stick with the 600 width, and in general even then, this should be the exception.
Google Sheets doesn't always have the best formatting options but increasing the size should be considered a last resort and try instead to drop the secondary label (the greeny colour isn't that easy to read in text anyway), or reducing the decimal precision, or lowering the font-size - but not too much!).
By using the standard size you'll easily see if this makes the chart difficult to read at that size, which can often be hidden by blowing it up to a larger size, without realising they will be a lot smaller in some formats.
Anyway if you have to go with non standard sizes, then it is possible.
See how this looks in the 2019 CSS chapter
{{ figure_markup(
  image="top-named-colors.png",
  caption="Top named colors.",
  description="Pie chart showing the most popular named colors. White is the most popular at 40%, then black at 22%, red 11%, and blue 5%.",
  chart_url="https://docs.google.com/spreadsheets/d/e/2PACX-1vQO5CabwLwQ5Lj1_9bbEFnFM1qEqCorymaBHrcaNiMSJ7sYDKHUI5iish5VAS-SxN447UTW-1-5-OjE/pubchart?oid=1985913808&format=interactive",
  width=600,
  height=415,
  sheets_gid="1987870596",
  sql_file="color-usage.sql"
  )
}}
See how this looks in the 2019 JavaScript chapter
{{ figure_markup(
  image="js-processing-reddit.png",
  alt="JavaScript processing times for reddit.com.",
  caption="JavaScript processing times for reddit.com. From [The cost of JavaScript in 2019](https://v8.dev/blog/cost-of-javascript-2019).",
  description="Bar chart showing 3 different devices: at the top a Pixel 3 has small amount on both the main thread and the worker thread of less than 400ms. For a Moto G4 it is approximately 900 ms on main thread and a further 300 ms on worker thread. And the final bar is an Alcatel 1X 5059D with over 2,000 ms on the main thread and over 500 ms on worker thread.",
  width=600,
  height=363
  )
}}
Note the use of single quotes in the caption value to allow use of double quotes in the text, and note the shorter alt attribute without the link to the source.
This allows you to link to a different tool, rather than just display the image in a larger format when clicked.
See how this looks in the 2019 Markup chapter
{{ figure_markup(
  link="https://rainy-periwinkle.glitch.me/scatter/html",
  image="element_categories.png",
  caption="Element popularity categorized by standardization.",
  description="Scatter graph showing HTML, SVG, and Math ML use relatively few tags while non-standard elements (split into \"in global ns\", \"dasherized\" and \"colon\") are much more spread out.",
  width=600,
  height=1065
  )
}}
Again note the use of escaped double quotes for the description in this example.
See how this looks in the 2019 Mobile Web chapter
{{ figure_markup(
  video="https://www.youtube.com/embed/Lx1cYJAVnzA",
  video_width=560,
  video_height=315,
  image="painful-loading-website.png",
  caption="Example of how painful of an experience waiting for JS to load can be.",
  description="Video showing two web pages loading and each page has a figure tapping repeatedly on a button throughout the video, to no effect. There is a clock ticking up from 0 seconds at the top, and an initial happy emoji face for each website, that starts to turn less happy as clock passes 6 seconds, wide-eyed at 8 seconds, angry at 10 seconds, really angry at 13 seconds and crying at 19 seconds shortly after which the video ends.",
  width=610,
  height=343
  )
}}
Note the different widths and heights for the video and the image.
See how this looks in the 2019 CSS chapter
{{ figure_markup(
  caption="Percent of desktop and mobile pages that include logical properties.",
  content="0.6%",
  classes="big-number",
  sheets_gid="1578885596",
  sql_file="02_05.sql"
)
}}
See how this looks in the 2019 CSS chapter
{{ figure_markup(
  caption="The largest known <code>z-index</code> value.",
  content="999999999999999999999999999999999999999999999999999999999999999999999999999999999999999999999999999999999999999999999999999999999999999999999999999999999999999999999999999999999999999999999999999999999999999999999999999999999999999999999999999999999999999999999999999999999999999999999999999999999999999999999999999999999999999999999999999999999999999999999999999999999999999999999999999999999999999999999999999999999999999999999999999999999999999999999999999999999999999999999999999999999999999999999999999999999999999999999999999999999999999999999999999999999999999999999999999999999999999999999999999999999999999999999999999999999999999999999999999999999999999999999999999999999999999999999999999999999999999999999999999999999999999999999999999999999999999999999999999999999999 !important",
  classes="really-big-number",
  sheets_gid="2073114478",
  sql_file="02_38.sql"
)
}}
Tables can be written in HTML or Markdown. Complex tables should be written in HTML with appropriate colspan, rowspan and scope attributes, as shown below.
The figure_link macro should be used to create figures names and other links in the caption.
See how this looks in the 2019 HTTP/2 chapter
<figure markdown>
| Protocol | Desktop | Mobile | Both   |
| -------- | ------- | ------ | ------ |
|          |  0.09%  |  0.08% |  0.08% |
| HTTP/1.0 |  0.09%  |  0.08% |  0.09% |
| HTTP/1.1 | 62.36%  | 63.92% | 63.22% |
| HTTP/2   | 37.46%  | 35.92% | 36.61% |

<figcaption>{{ figure_link(caption="HTTP version usage for home pages.", sheets_gid="1839783729", sql_file="20_01.sql") }}</figcaption>
</figure>
Note there needs to be a blank line between the table markdown and the figcaption (so that the markdown convertor knows the table has finished)
Headings should use <th> elements (except when empty when <td></td> should be used as <th></th> is invalid HTML) and should be given scope="colgroup" or scope="rowgroup"> attributes. colspan and rowspan can be used as appropriate.
Again the figure_link macro should be used to create figures names and other links in the caption.
See how this looks in the 2019 Security chapter
<figure>
  <table>
    <thead>
      <tr>
        <td></td>
        <th scope="colgroup" colspan="2" >No. of Home Pages</th>
        <th scope="colgroup" colspan="2" >% of Home Pages</th>
      </tr>
      <tr>
        <th scope="col">Prefix value</th>
        <th scope="col">Desktop</th>
        <th scope="col">Mobile</th>
        <th scope="col">Desktop</th>
        <th scope="col">Mobile</th>
      </tr>
    </thead>
    <tbody>
      <tr>
        <td><code>__Secure-</code></td>
        <td>640</td>
        <td>628</td>
        <td class="numeric" >0.01%</td>
        <td class="numeric" >0.01%</td>
      </tr>
      <tr>
        <td><code>__Host-</code></td>
        <td>154</td>
        <td>157</td>
        <td class="numeric">0.00%</td>
        <td class="numeric" >0.00%</td>
      </tr>
    </tbody>
  </table>
<figcaption>{{ figure_link(caption="Cookie prefix usage.", sheets_gid="1184654637", sql_file="08_38.sql") }}</figcaption>
</figure>
Note there does not need to be a blank line between the table and the figcaption for complex tables.
We need still graphics of all the Google Sheets for devices where the embeds will not show (e.g. Mobile Devices). I find the easiest way is to use Capture node Screenshot functionality in Chrome Dev Tools (Chrome 86 at least needed). Only issue with this is that Sheets disables right click so you have to hunt for the chart in Element tab of Dev tools - searching for the chart title works. You want the inner element with a width and height style:

Alternatively you can also use any browser extension that takes element screenshots like HTML Elements Screenshot.
Do not take screenshots manually as they typically are lower resolution and the dimensions will be off. Resolution is also poor in Google Sheets download options unfortunately, so it should also not be used.
Please run all screenshots through TinyPNG.com (which handles PNG and JPEG despite its name). We have a Calibre GitHub Action to automatically compress images raised in a Pull Request, but I find TinyPNG does a better compression job and images can be dragged on to it and downloaded in bulk to make this easy.
Images should be given description names, and not fig1.png (note this was used for some chapters last year, but trying to give more descriptive names this year). We used chapterslug-descriptive-name.png file names using dashes rather than underscores (e.g seo-canonical-implementation-method.png or http2-h2-usage.png)
Here's some tips and advice to make the most of your figures:
- Use the Figures Template Sheet, rather than trying to create your own charts for the standard ones. They are made with the Web Almanac style, fonts and colours. Of course if you think you can come up with a different visual then we love to see that (see the image at the top of this wiki) - but take guidance from the "standard" charts in terms of style and colour.
- The first colour is the pale green colour, but we normally concentrate on mobile, which is usually shown in the darker grey colour (it's the second colour as most stats are ordered and desktop shown before mobile). Beyond these two colours there are a few more but they are used less.
- Be aware that the green has colour contrast issues. We're aware of this and aim to fix it in the future. There are lots of mitigations so we still believe our figures are accessible, but it's not ideal. As I say, we will look to address in the future.
- Given that, try to avoid using green as the only colour, of when doing that ensure the labels are switch to the dark grey colour to be readable.
- Drop labels on green bars if too squashed. There is lots of precedent with this in Web Almanac (plus given the colour contrast issue I kind look for an excuse to drop them, truth be told).
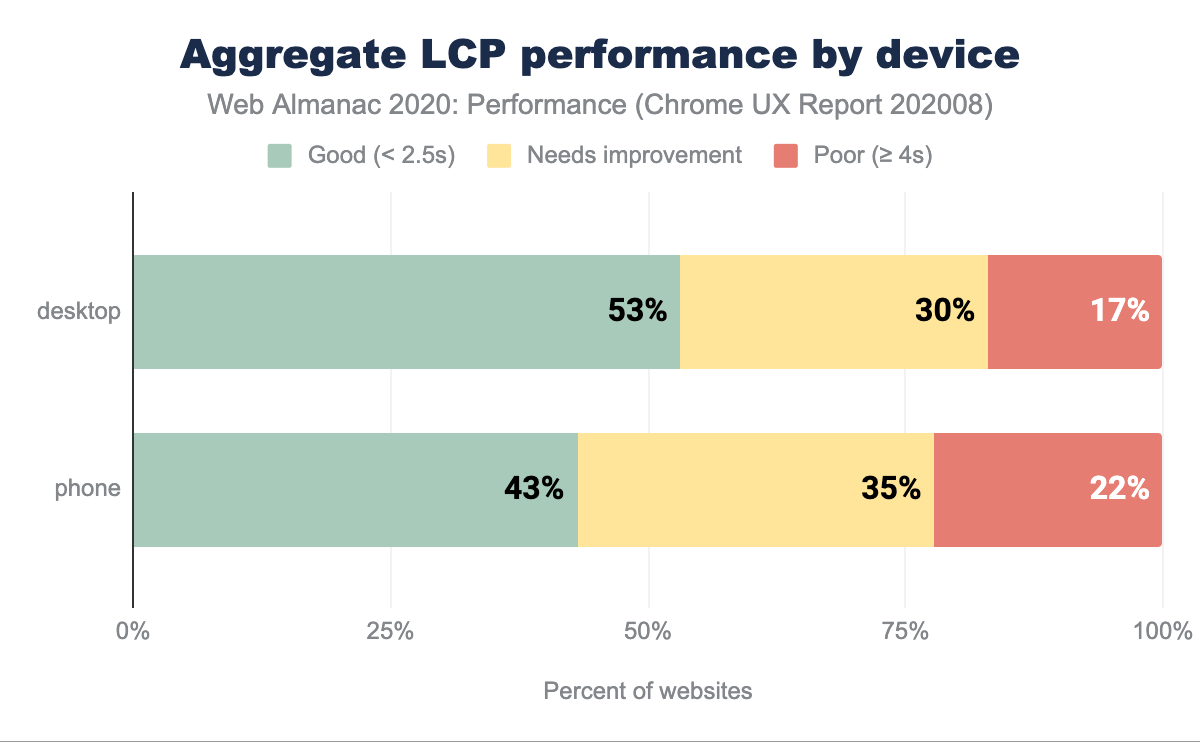
- There are other colours (Red, Yellow, Green) for Distribution Charts. In many (but not all!) places in the world they hold special meaning so try to avoid giving Red to good (e.g. latest TLS) and Green to bad. It is true this is far from universal, but is the case in many case and is also what CrUX uses.
- Titles, legends and axis titles should be in sentence case, except for proper nouns (e.g. "Distribution of desktop FCP performance")
- Make it clear if desktop is desktop or mobile if it doesn't include both. We like to put "(mobile)" after the chapter name subtitle (example).
- Include both desktop and mobile if no reason not to and fits on same chart. At same reason no need to include two charts, if it doesn't fit on one chart and it's near identical data (many chapters like to have a comment at the top saying that for that chapter there is little difference for most data so, unless otherwise noted only the mobile data is shown - but even then the charts should be labelled as such in case the chart is presented outside of the chapter).
- CrUX data gets it's own subtitle too example.
- Decide what decimal places to use in your chapters and be consistent throughout as much as possible. One decimal place is often enough, but for smaller and more niche numbers, more may be required. But also good to make sure they fit so even if using two, if they don't fit in the graph, then drop to one.
- Try to avoid going smaller than the default font size of 16. If have to do that, then that raises the question of whether you are showing too much data in chart. Should you limit number of data point shown to the top 5 most used stats? Or flip to horizontal where you can fit more by increasing the height?
- Do not increase the width beyond 600px where at all possible. It's been shown to work on mobile. Again, if you need to increase this, then it suggests you may be trying to squeeze too much information in. Ypu can (and should!) increase the height, but be aware any non default heights beyond 371 needs additional markup to be used.