
A btop-style terminal dashboard for your network. I got sick of having
to use multiple tools to diagnose network issues, so I built this. Think ping, traceroute, ifconfig, btop,
trippy, and bandwhich in a single view, so you can tell at a glance
whether it's the network, the Wi-Fi, the ISP, or your own machine that's the problem.


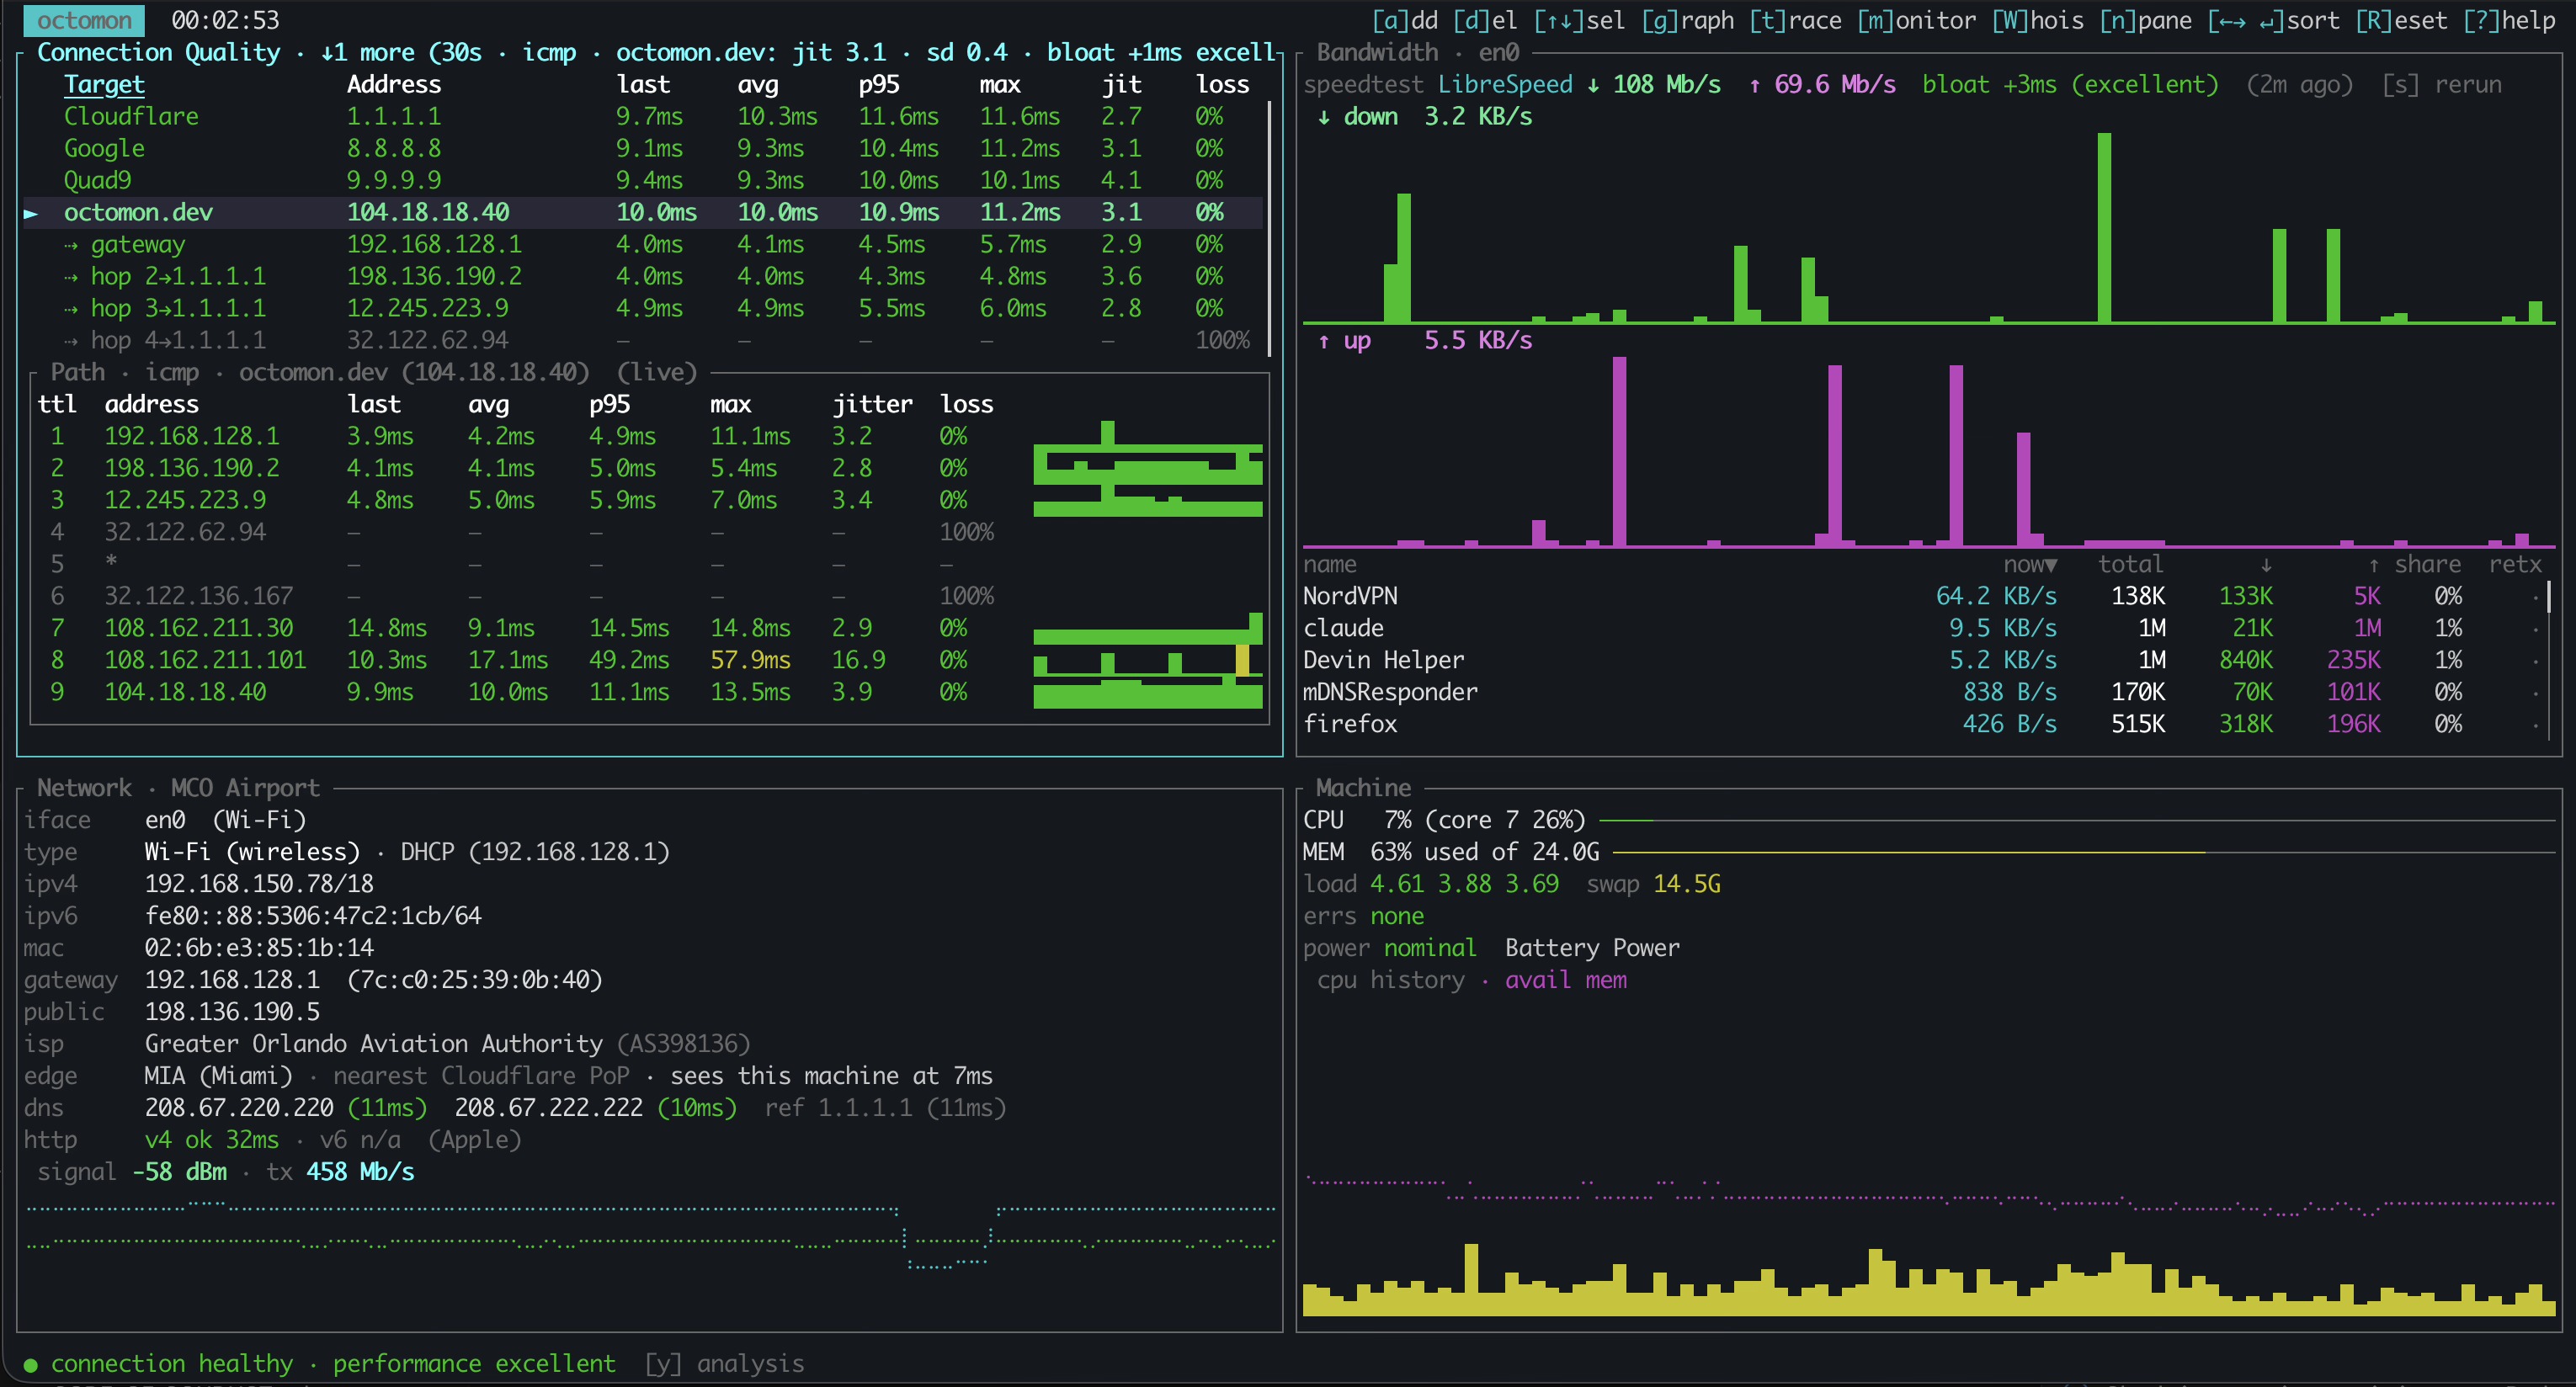
Four live panels plus a judgement on the your connectivity: a one-line analysis at the bottom
of the screen ("▲ gateway unresponsive", "● connection healthy") and y
for the triage ladder behind it. Every network related subsystem from your machine outward
(link → gateway → DNS → ISP path → internet → web → destinations) with its
status and evidence, healthy rungs included. Simultaneous causes are all
reported, a symptom is ranked below its cause rather than shouting over it, a
busy CPU or a VPN is a caveat rather than a way to hide a fault, and every
finding shows how long it has been going on.
The panels:
- Connection Quality — ICMP latency to configurable targets (last / avg /
p95 / max), jitter, loss and a bufferbloat grade, plus the same columns over
TCP connects to port 443 (
i), which keep working when ping is blackholed. When port 443 stops answering everywhere, an egress monitor probes HTTP, QUIC, SSH, NTP and DNS every 5 s and the table shows those rows instead, so a filtered network reads as filtered, not dead. Only the built-in anchors (1.1.1.1, 8.8.8.8, 9.9.9.9) vote on whether the internet is up; targets you add are judged one at a time against that consensus, and one that never answers pings is noted as quiet, not called down. Auto-discovers the gateway and next hops, traceroutes (t), monitors every hop MTR-style (m), and find out who owns an address (W). - Bandwidth — live throughput, an on-demand speed test (
s), and per-process talkers or the same traffic by remote address. Docker and Podman containers are talkers too, one row each (app (docker)), read from their own interface counters; on Linux that works without root and for every user's containers. - Network — interface, connection type (Wi-Fi / Ethernet / cellular / VPN tunnel), addresses, gateway (v4 and v6), each DNS resolver timed, Wi-Fi SSID/channel/signal and airspace congestion, and when notable, proxy, clock, path-MTU and NAT rows.
- Machine — "is my box the bottleneck?": CPU with the busiest core, memory pressure, load, interface errors, thermal throttling, and full screen the ten processes using the most CPU, so a maxed CPU comes with a name.
What it looks for beyond the graphs:
- Not connected at all — no default route, a self-assigned 169.254 address, an address with no gateway: named as such, not blamed on whatever failed first downstream.
- Captive portals, web blocked while ping works, IPv6 broken while IPv4 works (and where it breaks), the mirror case, and a system web proxy — detected, with the web check through it.
- DNS honesty, not just speed — a public reference resolver probed alongside yours (yours failing while it works means "switch DNS"; the reverse means this network forces its own), and a once-a-minute check that non-existent names come back NXDOMAIN rather than an ad page.
- System clock skew via NTP, CGNAT / double NAT read off the first
hops, path-MTU black holes where the OS lets them be measured, and
outbound port filtering (
c): SSH, mail, DNS-over-TLS, NTP, QUIC. - Per-network memory — a learned normal for each network you use and a persistent incident history, so the report can say "worse than usual here" and "3 outages this week, clustering 20–23h".
- Event timeline (
e) and a network history of every join, roam, address, route and VPN change. - The session bar — the row above the analysis line grades every slice of
the run from launch to now, oldest at the left: green fine,
yellow degraded, red down. Cells fold as the session grows, so a nine-hour
flight fits the same row a five-minute check does, and a one-minute outage
three hours ago is still visible. Wall-clock boundaries are marked by
shading their column rather than drawing over it, so the grid is regular
and nothing it touches is hidden. Press
bto walk it: each column says which minutes it covers and what was wrong with them,[and]skip to the next change,zzooms to the hour around the cursor, andEnteropens the timeline at that moment. - What else had just changed — a finding that raises seconds after a Wi-Fi
roam, a VPN coming up or the network moving says so ("
▲ latency degraded · 3s after a Wi-Fi roam"), on the timeline, in the analysis and in alerts. Correlation stated as correlation: it says when it started, not why.
Doctor mode — octomon --doctor observes headless for ~20s and prints the
analysis, this network's normal, its history, the measurements and recent
events; --json for machines. Redacted by default (SSID, IPs, MACs) so it is
safe to paste into a forum or ISP ticket; --full prints everything. Exit
codes: 0 healthy, 1 problems found, 3 couldn't measure. Twenty seconds
catches a hard fault, not an intermittent one, so when asking for help run it
longer, while the problem is happening:
octomon --observe 15m --doctorThat is the report to paste. --observe takes seconds or a time with a unit
(90s, 15m, 1h), up to an hour.
Watch mode — octomon --watch runs headless until Ctrl-C and prints each
finding as it raises and again when it ends; the intermittent dropout that
happens while nobody is looking is exactly the case the dashboard cannot help
with. Add --alert for a desktop notification, --alert-cmd to run something,
--alert-url to POST JSON at a webhook — any combination, and they work with
the TUI too. Alerts fire from the same hysteresised raise/clear transitions the
timeline records, so a flapping link does not become a flapping notification,
and the payload reaches a command through the environment (OCTOMON_TEXT,
OCTOMON_SEVERITY, OCTOMON_CAUSE, …), never substituted into your command
string. Settings persist under [alert] in the config.
octomon --watch                                    # print findings, nothing else
octomon --watch --alert                            # + desktop notifications
octomon --watch --alert-cmd 'ntfy pub mytopic "$OCTOMON_TEXT"'
octomon --watch --alert-url https://example.com/hook --alert-level down
On macOS, --alert posts through osascript, which means the system
attributes the notification to Script Editor and clicking one opens that
rather than anything useful. With brew install terminal-notifier octomon
uses it instead, and a click brings your terminal to the front.
Any session can be recorded to CSV with l, and D writes a support
bundle (report, routes, events, config and data files) to your Desktop.
brew tap securitypedant/octomon
brew trust securitypedant/octomon   # one-time: acknowledge this third-party tap
brew install octomonSigned repository at octomon.dev, amd64 and arm64:
curl -fsSL https://octomon.dev/apt/octomon.gpg | sudo tee /usr/share/keyrings/octomon.gpg >/dev/null
echo "deb [signed-by=/usr/share/keyrings/octomon.gpg] https://octomon.dev/apt stable main" | sudo tee /etc/apt/sources.list.d/octomon.list
sudo apt update && sudo apt install octomonStatic musl binaries run on any distribution; the installer picks the right
architecture and drops it in ~/.cargo/bin:
curl --proto '=https' --tlsv1.2 -LsSf \
https://github.com/securitypedant/octomon/releases/latest/download/octomon-installer.sh | shx64 and ARM64, from the winget community repository:
winget install SimonThorpe.OctomonWithout winget, the PowerShell installer picks the right binary:
irm https://github.com/securitypedant/octomon/releases/latest/download/octomon-installer.ps1 | iexThe binary is unsigned, so SmartScreen warns on first run. Windows Terminal is recommended.
cargo install octomon            # needs Rust 1.95+
# or
git clone https://github.com/securitypedant/octomon && cd octomon && cargo build --release
Plain tarballs and zips for every platform are on the releases page.
octomon with no arguments opens the dashboard. Everything else either picks a
one-shot mode or overrides a config setting for that run; --help is the
complete list.
Modes — each observes, prints, and exits:
octomon --doctor [--json] [--full] [--speedtest] [--observe TIME]   # TIME: 90s, 15m, 1h
octomon --bundle [PATH]      # write the [D] support zip and print where it landed
octomon --check              # a one-shot text snapshot (no TUI)
octomon --log                # record to CSV immediately (headless recorder)
octomon --paths              # where the config, data and bundles live
Overrides — config settings, for this run only:
octomon -t Home=192.168.1.1          # extra ICMP target (repeatable)
octomon --config ~/work.toml         # a different config file (second profile)
octomon --ping-interval 500          # ping interval (ms); --ping-timeout too
octomon --iperf3 lab=10.0.0.5 --speedtest-provider lab
octomon --bandwidth-units bits       # KB/s → Kb/s
octomon --theme light                # auto | dark | light
Turn things off: --no-speedtest, --no-discovery (skip the startup
traceroute), --no-edge (never call octomon.dev/edge).
Screen recording: --demo measures for real but hides the few things
that place you: your public IPv4 and IPv6 addresses (and the global IPv6 on
the interface), the MAC addresses, and the SSID, everywhere they appear. The
LAN, the resolvers, every hop, the remote addresses the machine talks to and
their whois records stay real, because they are what a demo is about.
--demo-mac disguises only this machine's MAC. Neither shows process command
lines.
Scripting a bundle, since it prints its path and nothing else:
zip=$(octomon --bundle --observe 60) && echo "collected $zip"Press ? in the app for the complete, always-current list. The essentials:
| Key | Action |
|---|---|
Tab / ⇧Tab · f · n |
Cycle panels · full-screen · next sub-pane |
y |
Connection analysis: the triage ladder and findings |
s · w |
Speed test · stats window (30s/1m/5m/15m) |
r · G |
Re-probe network info · rescan gateway, hops and public IP |
e · c · T · M |
Events · outbound port scan · routing table · marker |
l · D |
Record session to CSV · write a support-bundle zip |
P · ? · Esc · q |
Pause the display · help · back · quit |
# |
Plain ↔ fine graph glyphs, for a font without braille or block characters (saved) |
↑/↓ (or j/k) · PgUp/PgDn |
Move the cursor · by ten |
← → · Enter |
Move sort column · sort / flip direction |
⇧R · Ctrl+R |
Reset this panel · erase all config and stored data |
| Connection Quality | |
a / d · i |
Add / delete a target · stats ICMP ↔ TCP :443 ↔ egress (once the monitor has run) |
g · t · m · W |
Graph · traceroute once · monitor every hop · whois |
| Bandwidth | |
n · z · / |
Processes → remotes → history · zoom · filter rows (the graphs follow) |
v / I / V |
Cycle · add · remove a speed-test provider |
W / a · p / u · o |
Whois / add remote · pin / unpin · follow row |
| Network | |
N · L |
Name this network · saved locations and their history |
v cycles between Cloudflare (speed.cloudflare.com), M-Lab (NDT7),
LibreSpeed (a public server, or your own via librespeed_server), and any
iPerf3 servers you add with I as Name=host[:port]. iPerf3 shells out to
the iperf3 binary (brew install iperf3 / apt install iperf3) for 8 seconds
each direction against a server you control — no third party at all. Every run
is saved to the history.
On first run octomon writes a config file you can edit:
- Config:
~/.config/octomon/config.toml(honours$XDG_CONFIG_HOME;%APPDATA%\octomon\on Windows). Targets, timings, endpoints, the reference resolvers, the NTP server, the egress-scan and egress-monitor lists,theme = "light"if the terminal-background probe guesses wrong. - Data (
~/.local/share/octomon/, honours$XDG_DATA_HOME;%LOCALAPPDATA%\octomon\on Windows):speedtests.jsonl(speed-test history),baselines.json(each network's learned normal),history.jsonl(finished incidents per network, kept 90 days),net_history.jsonl(link, address, route and VPN changes),whois.log(everyWlookup, trimmed to the most recent 8 MB),errors.log, andoctomon-<timestamp>.csvrecordings while recording is on. The empty.<name>.lockfiles beside them let a dashboard and a--watchshare the files; abaselines.jsonthat stops parsing is moved tobaselines.json.corrupt(then.corrupt.1…) for repair by hand.
All of it describes your network, so octomon writes it owner-only — mode 0600
in 0700 directories, and files from older versions are tightened at startup.
Most of what octomon does is best-effort: a traceroute that won't run, a whois
that times out, an iperf3 binary that isn't installed, a public-IP endpoint
answering with a hotel's sign-in page. None of those stop the dashboard, and
most never reach the screen at all — so each one also appends a line to
errors.log in the data folder, with a banner marking every restart:
=== octomon 0.9.5 started · macos · pid 41207 · 2026-08-27T09:14:02.118+01:00 ===
2026-08-27T09:14:04.702+01:00  discovery   traceroute toward 1.1.1.1 answered no hops — the path is filtered, or a captive portal is in the way
2026-08-27T09:14:14.881+01:00  public-ip   https://api.ipify.org: no address in the answer
Repeats of the same message fold into a count so one broken thing can't bury
the rest, and the file rolls to errors.log.1 at a megabyte. The last few
lines of the current run also appear in octomon --doctor and in the D
support bundle.
octomon runs unprivileged by design and never asks for a password; it tells you at startup what that costs on your machine.
| Platform | Unprivileged | To get everything |
|---|---|---|
| macOS | everything (path MTU can't be measured — the OS fragments regardless of the DF flag, and octomon says so rather than guessing) | nothing to do |
| Linux | latency often needs a one-line sysctl; per-process bandwidth sees only your own processes (containers are seen regardless) | open the ping-socket range once, and sudo octomon for the full process view |
| Windows | everything except per-process bandwidth; path MTU not measured yet | join Performance Log Users once |
Linux also leans on a few external tools (traceroute, ss, nmcli, iw)
that not every distribution ships. octomon probes for them at startup and names
the missing package; sudo apt install traceroute iw covers the common gap.
Detail, commands and reasoning: PRIVILEGES.md.
octomon only measures — it changes nothing on the network and listens on no port — but as a network tool it does make outbound requests. Everything it contacts, and why:
| Endpoint | When | Why | Data sent |
|---|---|---|---|
Your ICMP targets (default 1.1.1.1, 8.8.8.8, 9.9.9.9, octomon.dev), plus the gateway and first hops found by a startup traceroute toward discovery_probe |
continuously | latency/loss | ICMP echo |
The IPv6 side of the same, only while the interface holds a global IPv6 address: the v6 router, the built-in anchors' IPv6 twins (2606:4700:4700::1111, 2001:4860:4860::8888, 2620:fe::fe), and the first hops of a traceroute toward the probe's v6 twin |
continuously | is IPv6 configured here, does the router carry it, does the route beyond | ICMPv6 echo; TCP handshakes to the twins' port 443 |
| Your ICMP targets, over HTTPS | every 5 s | is the web service up (HEAD, no body, no redirects, certificate errors tolerated — a timing probe) | a HEAD / |
| Your anchor targets, TCP port 443 | every second | connect-time latency/loss that works where ICMP is blocked (a handshake, closed immediately; no data sent) | a TCP handshake |
octomon.dev/edge (edge_check_url), once over IPv4 and, on a dual-stack link, once over IPv6 |
at startup, on network change, then every 15 min | how the Cloudflare edge sees this connection over each family: serving PoP, your ISP's AS, the edge's own TCP RTT to you — plus the latest released version, so octomon can mention an update (it never updates itself) | a GET with octomon's User-Agent, the call's reason and the build's platform (plat=macos-arm64, one of six); the endpoint stores nothing about you — see octomon.dev/privacy |
Your system's DNS resolvers, and the reference resolvers (dns_reference_resolvers, default 1.1.1.1 and 8.8.8.8) |
every 5 s; once a minute a random non-existent name | resolver latency; hijack check; proof the internet path is up when pings and the web are not | one A query for dns_probe_name (default example.com) |
cloudflare.com:80, 1.1.1.1:443 (QUIC), github.com:22, time.cloudflare.com:123, 1.1.1.1:53 (egress_monitor_checks) |
only while TCP :443 to every anchor is failing, every 5 s until it answers again; announced on the timeline |
is this a filtered network or a dead one — which ports still get out | a TCP handshake or one datagram; nothing further (egress_monitor = false turns it off) |
Your OS's own connectivity-check URL (captive.apple.com, msftconnecttest.com or connectivity-check.ubuntu.com), and through the system proxy when one is set |
every 12 s | HTTP reachability, captive-portal detection, clock skew fallback | a GET |
time.cloudflare.com (ntp_server) |
at startup, then every 15 min | is the system clock right | one NTP packet |
1.1.1.1:443 and, on a dual-stack link, 2606:4700:4700::1111:443 (QUIC) |
once after startup / network change | path-MTU probe, per family (Linux) | padded QUIC version-negotiation packets |
api.ipify.org, and api64.ipify.org over IPv6 only (public_ip6_url) |
once at startup and on network change | discover your public IPv4 and IPv6 to add as targets | none (a GET) |
rdap.org (→ ARIN, RIPE, APNIC, LACNIC, AFRINIC) and stat.ripe.net; the system whois as fallback |
only when you press W |
who owns that address / which ASN announces it | the address you asked about |
github.com:22, smtp.gmail.com:25/465/587, imap.gmail.com:993, cloudflare.com:80/443, 1.1.1.1:53/853/443 (egress_checks); on a dual-stack link also cloudflare.com:80/443, time.cloudflare.com:123 and 2606:4700:4700::1111:53/443 over IPv6 |
only when you press c |
which ports this network lets out, per family | a TCP handshake or one datagram; nothing further |
speed.cloudflare.com · locate.measurementlab.net + an M-Lab server · librespeed.org list + a LibreSpeed server |
only when you press s |
speed test | filler bytes |
| Your own configured iPerf3 servers | only when you press s with one selected |
speed test via the iperf3 binary |
filler bytes |
Notes:
- Speed tests and the port scan are on-demand only.
- Third-party responses are read with a hard size cap, and text that arrives from outside (SSIDs, registry records, process names) has control characters stripped before it reaches your terminal.
- The only octomon-operated endpoint is
octomon.dev/edge, which exists purely to deepen the monitoring: it returns your connection's edge view to you and stores nothing about you — no logs, no identifiers. The single thing it counts is requests per octomon version, platform (one of the six builds it ships as, likemacos-arm64) and call reason (start / netchange / refresh, three constant labels identical across every client), and that count is published, in full, at octomon.dev/privacy — the only dashboard that exists. Setedge_check_url = ""to never call it. No other telemetry of any kind is collected. - Turn any of it off or point it elsewhere in
config.toml:public_ip_url,discovery_probe,dns_reference_resolvers,ntp_server(""disables),http_probe_provider,egress_checks,egress_monitor,egress_monitor_checks,edge_check_url,public_ip6_url; andprobe_ipv6 = falsedrops every IPv6 extra (twins, v6 router and path, v6 MTU and edge checks, the scan's v6 rows) in one go. - Everything octomon writes about your network stays on your machine, readable
only by you. The files listed under Configuration —
recordings, baselines, incident and network history,
whois.log,errors.log— include your SSID, gateway and addresses. TheDsupport bundle gathers all of them, unredacted and by design, so it is worth a look before sending one on;--doctoris the redacted thing to paste.
Issues and PRs welcome — see CONTRIBUTING.md. cargo fmt,
cargo clippy, and cargo test should all be clean (CI enforces this). Please
follow the Code of Conduct; report security issues per
SECURITY.md.
Licensed under either of
- MIT license (LICENSE-MIT)
- Apache License, Version 2.0 (LICENSE-APACHE)
at your option.